Thư viện tri thức trực tuyến
Kho tài liệu với 50,000+ tài liệu học thuật
© 2023 Siêu thị PDF - Kho tài liệu học thuật hàng đầu Việt Nam
Tài liệu đang bị lỗi
File tài liệu này hiện đang bị hỏng, chúng tôi đang cố gắng khắc phục.
Sample essay band 8 9
Nội dung xem thử
Mô tả chi tiết
https://www.facebook.com/hocvietielts Page 1
Band 9 Task 1
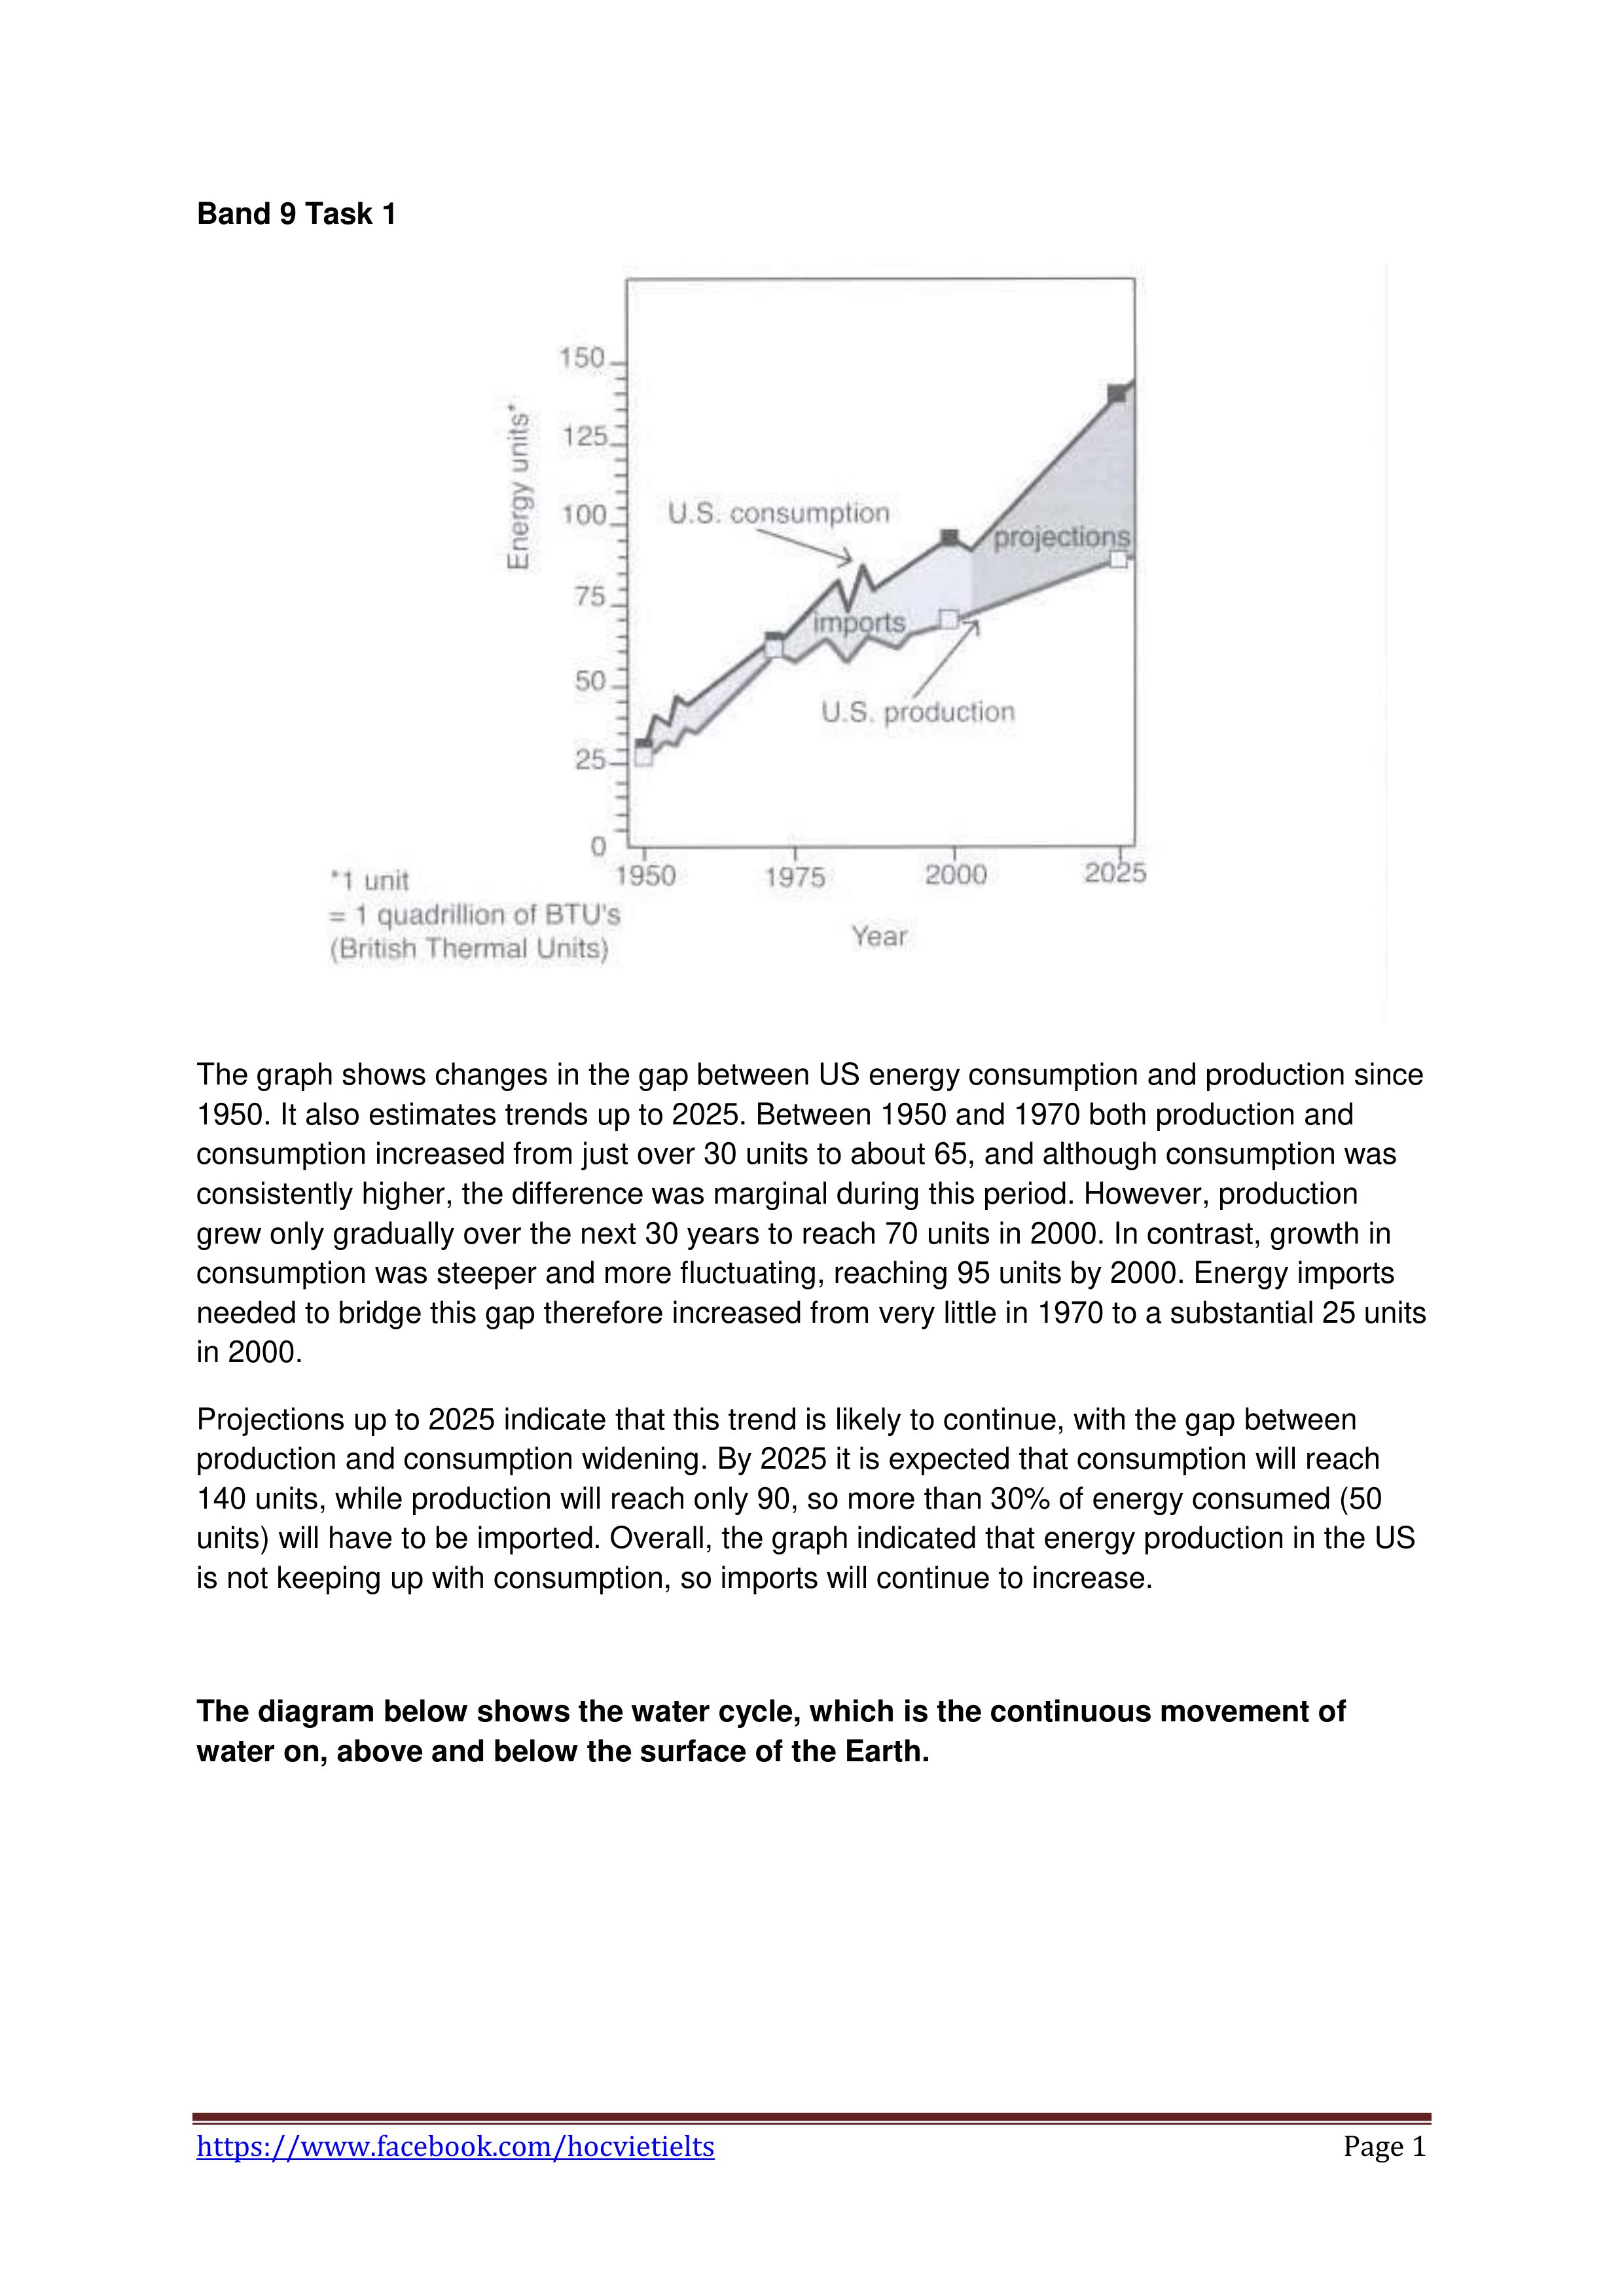
The graph shows changes in the gap between US energy consumption and production since
1950. It also estimates trends up to 2025. Between 1950 and 1970 both production and
consumption increased from just over 30 units to about 65, and although consumption was
consistently higher, the difference was marginal during this period. However, production
grew only gradually over the next 30 years to reach 70 units in 2000. In contrast, growth in
consumption was steeper and more fluctuating, reaching 95 units by 2000. Energy imports
needed to bridge this gap therefore increased from very little in 1970 to a substantial 25 units
in 2000.
Projections up to 2025 indicate that this trend is likely to continue, with the gap between
production and consumption widening. By 2025 it is expected that consumption will reach
140 units, while production will reach only 90, so more than 30% of energy consumed (50
units) will have to be imported. Overall, the graph indicated that energy production in the US
is not keeping up with consumption, so imports will continue to increase.
The diagram below shows the water cycle, which is the continuous movement of
water on, above and below the surface of the Earth.
https://www.facebook.com/hocvietielts Page 2
The picture illustrates the way in which water passes from ocean to air to land during the
natural process known as the water cycle.
Three main stages are shown on the diagram. Ocean water evaporates, falls as rain, and
eventually runs back into the oceans again.
Beginning at the evaporation stage, we can see that 80% of water vapour in the air comes
from the oceans. Heat from the sun causes water to evaporate, and water vapour
condenses to form clouds. At the second stage, labelled „precipitation‟ on the diagram, water
falls as rain or snow.
At the third stage in the cycle, rainwater may take various paths. Some of it may fall into
lakes or return to the oceans via „surface runoff‟. Otherwise, rainwater may filter through the
ground, reaching the impervious layer of the earth. Salt water intrusion is shown to take
place just before groundwater passes into the oceans to complete the cycle.
Graph Sample 1